

May Market Update
Disclaimer: All data is sourced from Altus Data Studio, which reports commercial real estate transactions valued at $1,000,000 or more. Information presented reflects activity in the markets of Oakville, Burlington, Mississauga, Milton, and Brampton. Readers are encouraged to verify all details independently before making any real estate decisions.
As we move through Q2, commercial real estate activity across the western GTA continues to show signs of both resilience and recalibration. In May 2025, total transaction volume across Oakville, Burlington, Mississauga, Milton, and Brampton topped $595 million—marking a 31% increase year-over-year. But beneath the headline growth, each market tells a different story. From Mississauga’s surge in office and industrial trades to Brampton’s sharp pullback in transaction volume, investors and owners are making more calculated moves. Below is a breakdown of key trends by municipality, followed by our quick-scan summary if you're short on time.
Quick Summary – What You Need to Know
Total volume surged: Over $595M in commercial sales across all five markets, up 31% year-over-year.
Mississauga led in activity and growth, nearly doubling its total volume with standout office and industrial deals.
Oakville posted a strong rebound, particularly in industrial and apartment assets.
Brampton volume declined across the board aside from two notable apartment sales.
Milton saw a jump in deal count and price growth, thanks to big-ticket land and industrial sales.
Burlington had more transactions but softer dollar volume, suggesting more smaller-scale activity.

Oakville
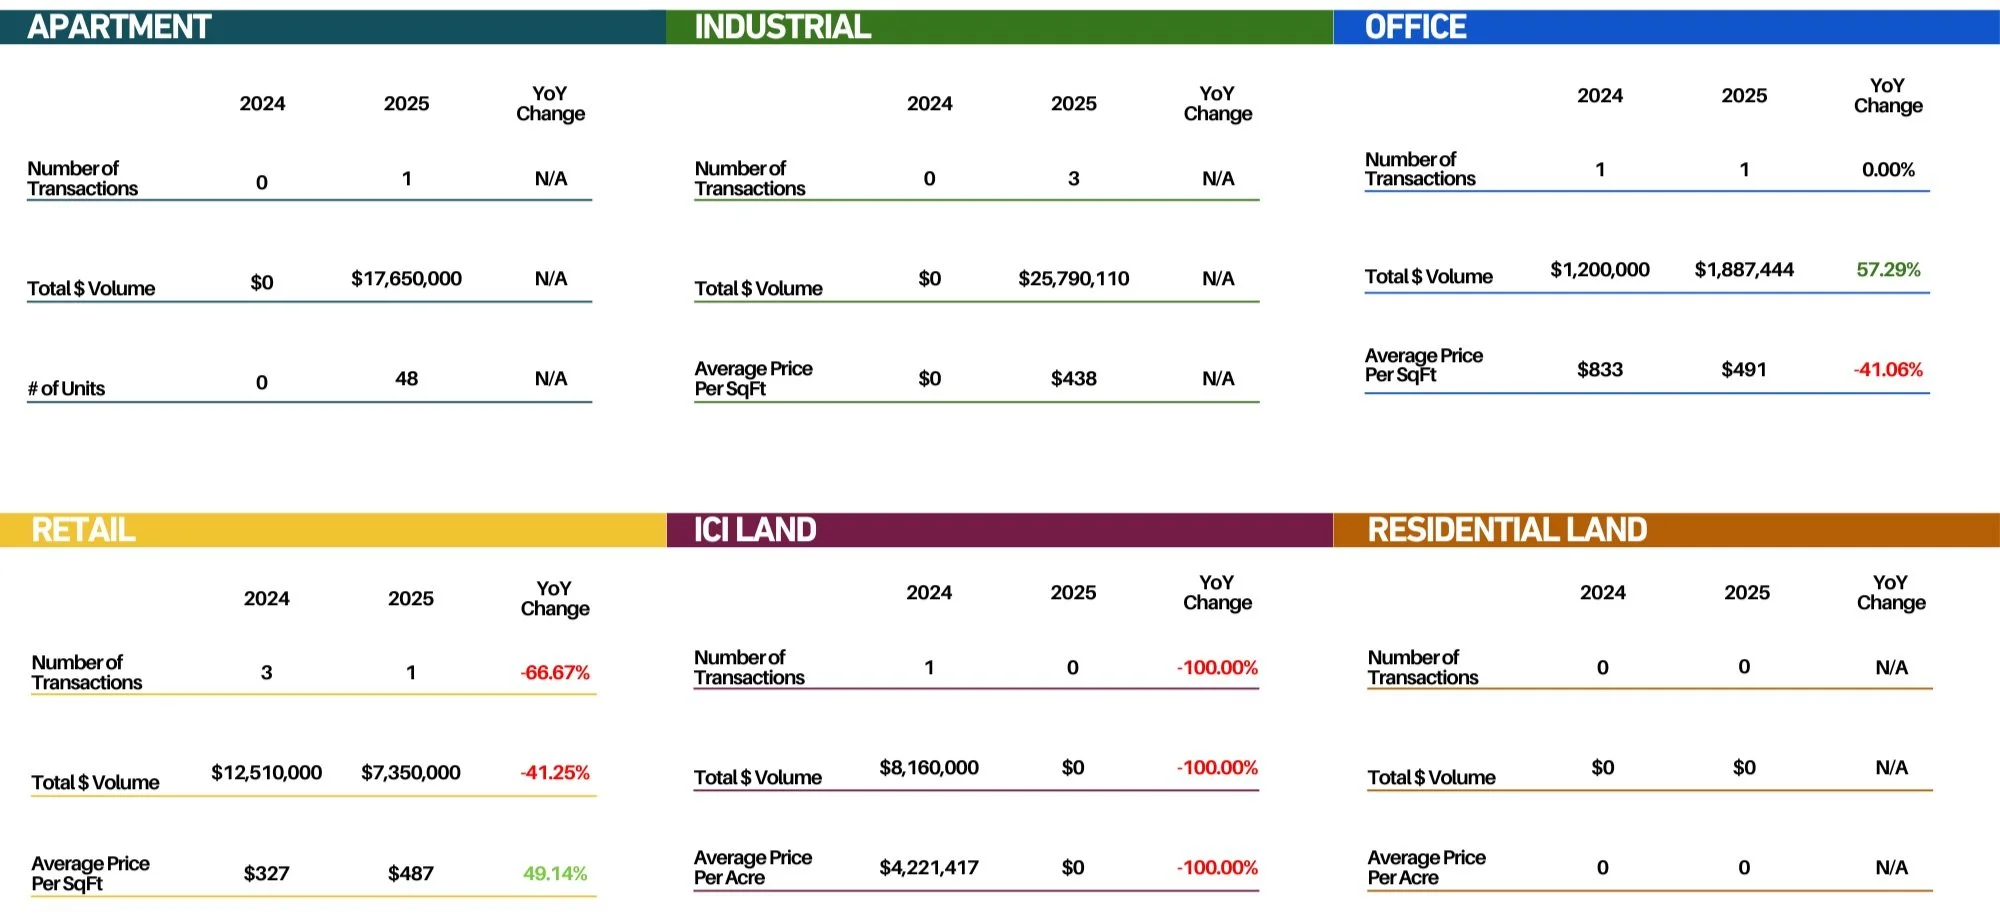
Oakville's commercial market showed signs of targeted growth in May 2025, with total transaction volume jumping 141% year-over-year, led by new activity in the apartment and industrial sectors. Apartment sales, which registered no activity in May 2024, surged with a single transaction valued at $17.65M. Industrial followed suit with three transactions totalling over $25.7M. This growth likely reflects a combination of investor interest in stable, long-term asset classes and owner-occupiers capitalizing on strategic locations. Although retail pricing climbed to $487 per square foot (up 49%), this represents only one acquisition in this category, this month. Land sales were insignificant in the month of May. This may reflect some hesitation in Oakville’s retail development pipeline or challenges in deal structuring for land.
Oakville saw 6 transactions this May compared to 5 transactions last May.

Burlington
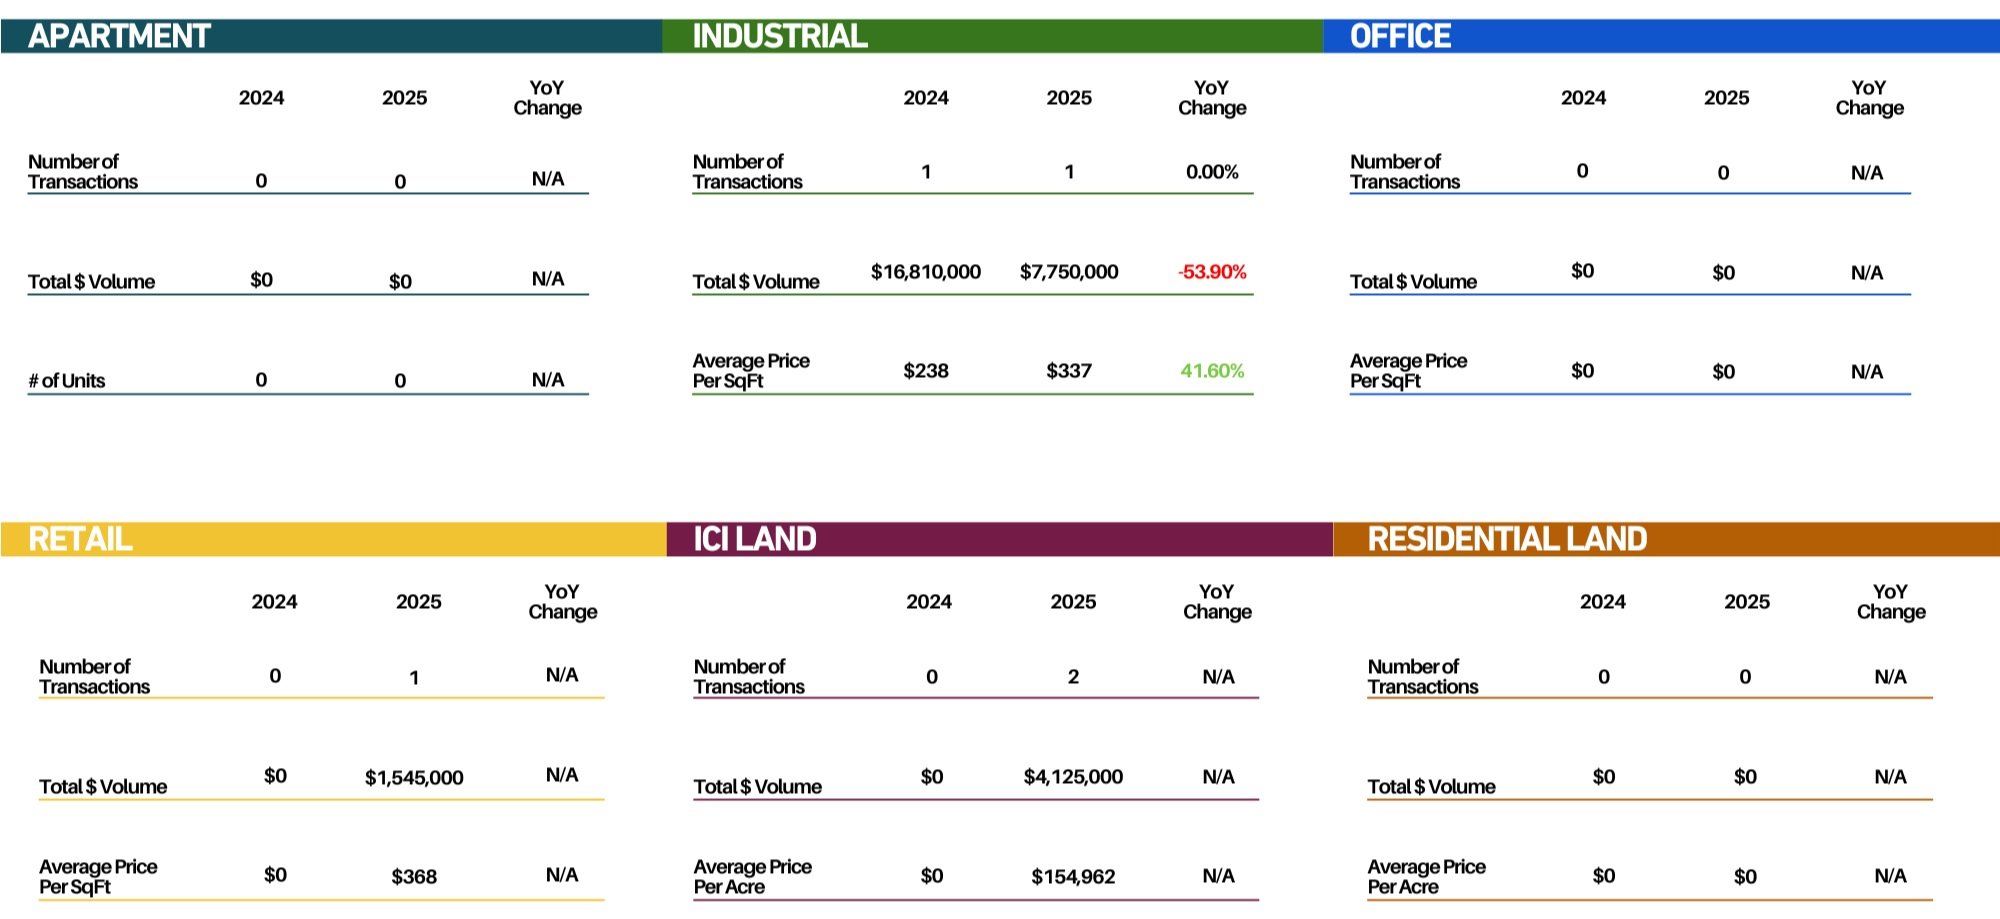
Despite a 300% increase in deal count this May, Burlington only saw 4 transactions total. The bulk of volume came from ICI land activity. Industrial properties traded at an average of $337 per square foot, up over 40% from last year. Despite the small sample size this could suggest stronger confidence that we haven’t seen this year from buyers. Burlingtons overall transaction volume decreased by ~20% from last year and last month.
Burlington saw 4 transactions this May compared to 1 transaction last May.

Mississauga
Mississauga remained the region’s powerhouse, recording $297M in transaction volume, up a striking 95% year-over-year. Although the number of deals remained flat at 20, the quality and scale of trades significantly increased. The office sector stood out, with $20.1M in sales across 4 transactions, an almost 1000% increase in dollar volume from the year prior—suggesting confidence in repositioned or well-located assets. Apartment sales re-entered the scene with a $24.4M acquisition after zero activity last year. Industrial still led in total volume with $222.7M, but the average price per square foot dipped slightly, likely due to larger footprint assets trading at slightly lower rates. ICI Land sales aw 2 transactions compared to 1 last year, with a 47% decrease in $ volume.
Mississauga saw 20 transactions this May, the same as last May.

Milton
Milton saw a 100% year-over-year increase in the number of transactions, going from 2 to 4, with dollar volume up slightly at 1.7%. What’s most notable is the shift in asset types: unlike May last year transaction activity was spread out amongst the asset classes. A notable $50M industrial transaction took place along with office, retail, and ICI land. Milton’s evolving mix of asset classes suggests increasing investor confidence in core assets over speculative land plays.
Milton saw 4 transactions this May compared to 2 transactions last May.


Brampton
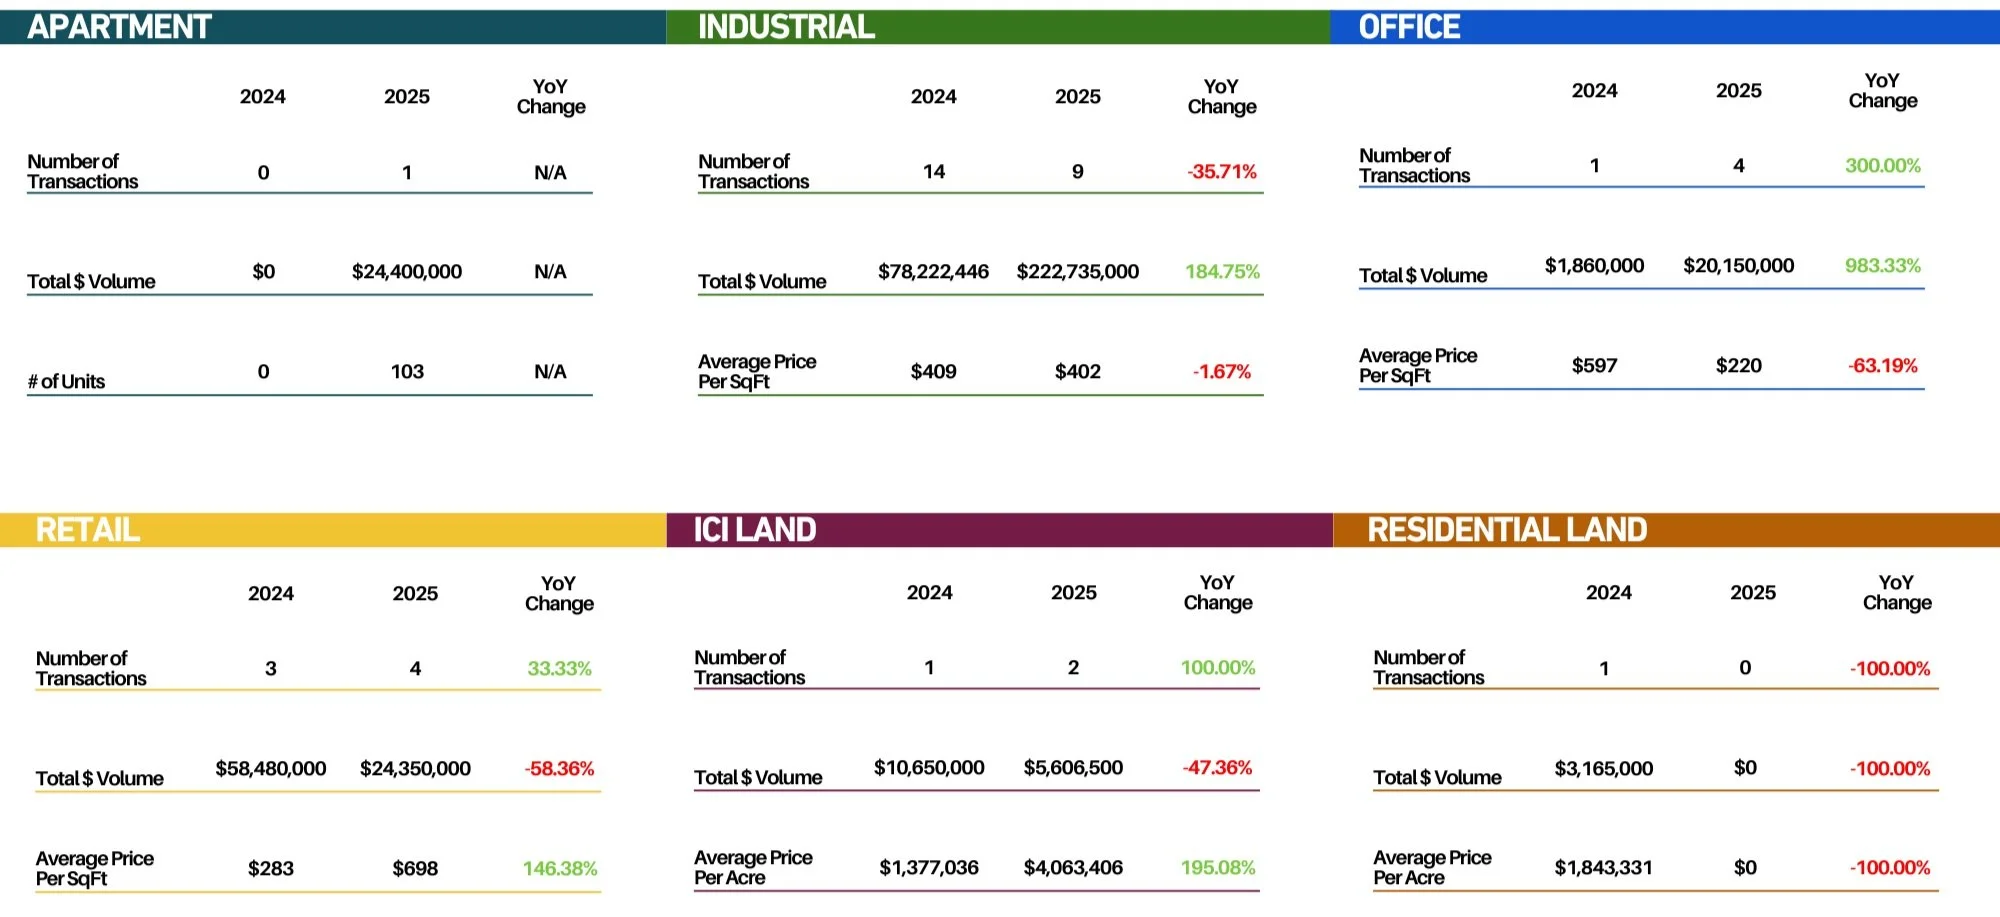
Brampton experienced a significant pullback in total transaction volume, falling 16% year-over-year, but the story is more nuanced. Apartment sales re-entered the scene with two large transactions totaling $132M, a sharp contrast to no activity last year. Industrial, office, and, retail volumes fell sharply, with industrial down over 92%. Residential land saw a steep drop. Land trades that did occur averaged over $1.2M per acre, up 157%, pointing to ongoing interest in development when zoning and timing are right.
Brampton saw 8 transactions this May compared to 15 transactions last May.

